8.6 Animations
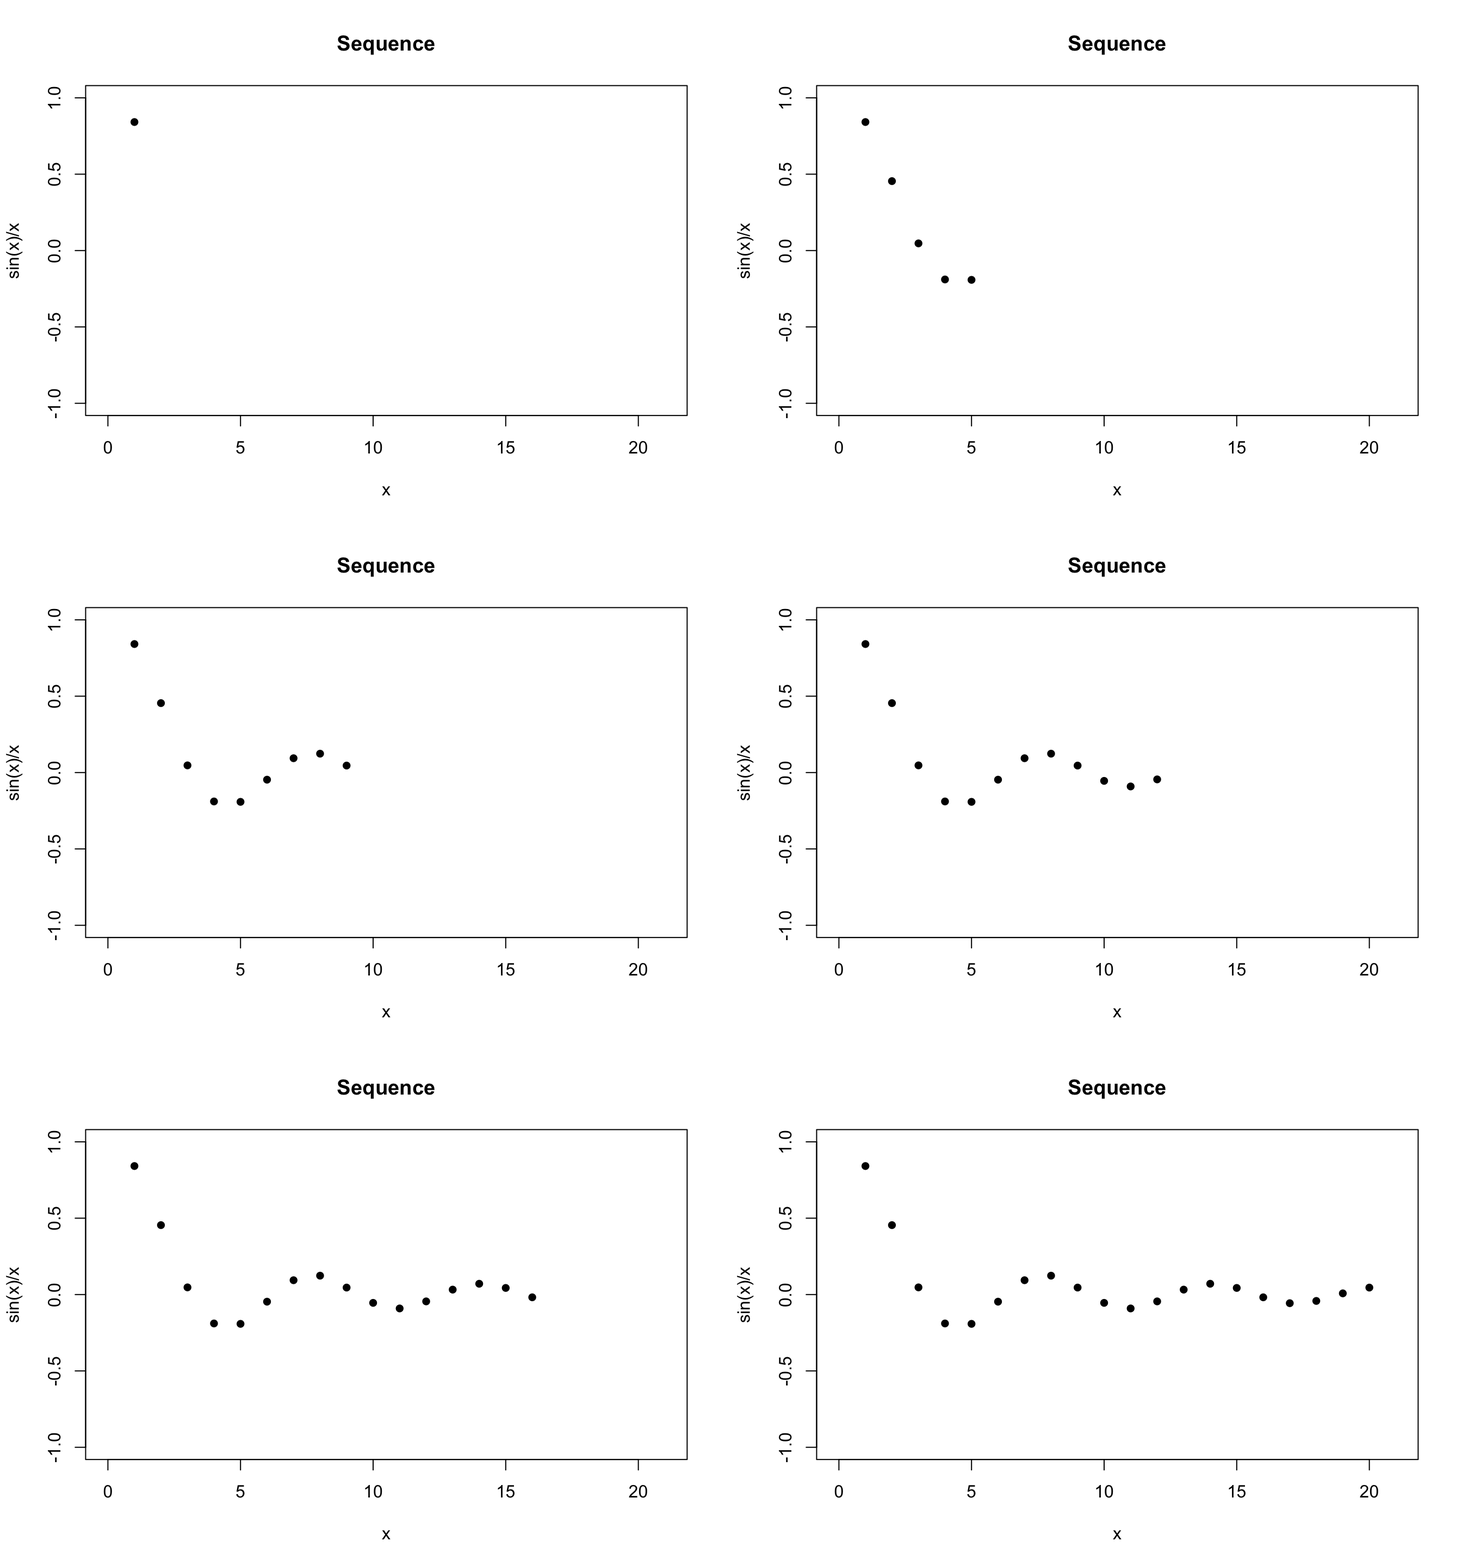
The gifski package can assemble a set of sequential plots into a GIF image, and thus an animation.
- Install the gifski package.
- Insert a R chunk. Add animation.hook=gifski in the chunk option.
- Set the time interval between frames, e.g., interval=0.25.
- Set cache=TRUE to speed up the processing time.
```{r, animation.hook="gifski", interval=0.25, cache=TRUE}
```- Add a set of sequential plots into the R chunk through a for-loop.
# Define the function f(x)=sin(x)/x
f <- function(x){
  return(sin(x) / x)
}

# Animation created from a for-loop
for (n in 1:20) {
  plot(1:n, f(1:n),
       pch=16,            # Use a filled dot for each point
       xlim = c(0,21),    # The range of the x-axis
       ylim = c(-1, 1),   # The range of the y-axis
       main = 'Sequence', # Title
       xlab = 'x',        # x label
       ylab = 'sin(x)/x'  # y label
  )
}