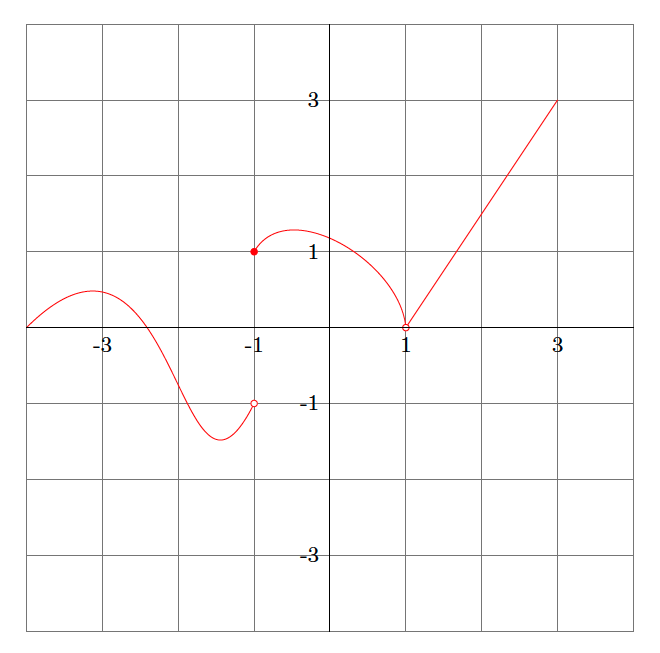
1.4 Curves on a Grid
Required package: \usepackage{tikz}.
This section illustrates how to create a grid, add curves, and use for-loop.
- The
help linesoption in\drawcommand creates grid lines between the lower left corner and the upper right corner points. - There are two ways to bend a curve between two points.
- Use control points in between to pull the curve in a certain direction. For example, the curve between (-4, 0) and (-1, -1) is lifted up by (-2, 2) and dragged down by (-2, -3).
- Specify the outgoing and incoming angles. For example, the curve between (-1, 1) and (1, 0) departs at 60\(\circ\) and arrives at 95\(\circ\).
- The
\foreachcommand is the for-loop in tikz. In the index set, for example,{-3, -1, ..., 3}, the...saves the work to type all numbers in the set.
\begin{tikzpicture}[scale = 1]

\draw[help lines] (-4, -4) grid (4, 4);
\draw [red] (-4, 0) .. controls (-2, 2) and (-2, -3) .. (-1, -1);
\draw [red] (-1, 1) to [out=60, in=95] (1, 0) to (3,3);

\draw [red, fill=red] (-1, 1) circle (1.2pt);     % Solid dot
\draw [red, fill=white] (-1, -1) circle (1.2pt);  % Open dot
\draw [red, fill=white] (1, 0) circle (1.2pt);    % Open dot

\foreach \t in {-3, -1, ..., 3}{
    \node [anchor=north] at (\t, 0) {\tiny\t}; % x tickmarks
    \node [anchor=east] at (0, \t) {\tiny\t};  % y tickmarks
}

\draw (-4, 0) -- (4, 0);  % x-axis
\draw (0, -4) -- (0, 4);  % y-axis
\end{tikzpicture}